
by Alexander Sedov | May 17, 2021 | Posters for INI2021, Posters for INI2021 – Special Session on Nitrogen Footprint
Nitrogen footprint calculator for Germany Tools to calculate personal footprints can help assess and communicate the impact of lifestyle and consumption choices to individuals. In comparison to carbon footprints however, nitrogen footprints are less well-known to the...
by Alexander Sedov | May 17, 2021 | Posters for INI2021, Posters for INI2021 – Special Session on Nitrogen Footprint
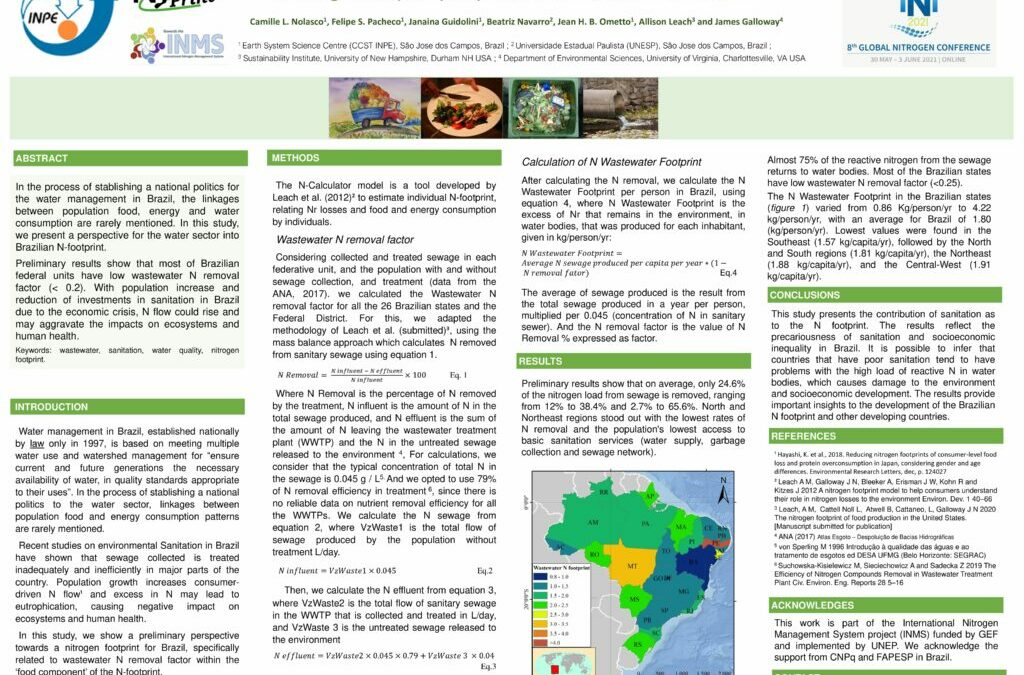
A nitrogen footprint perspective for Brazilian water sector Water management in Brazil, established nationally by law only in 1997, is based on meeting multiple water use and watershed management for “ensure current and future generations the necessary availability of...

by Alexander Sedov | May 17, 2021 | Posters for INI2021, Posters for INI2021 – Special Session on Nitrogen Footprint
Reducing the nitrogen footprint of Portuguese wine Nitrogen (N) is a key nutrient in crop production and crucial in vineyard management. When excessive reactive N is present in the environment, it may not only reduce crop production and increase pests and diseases...

by Alexander Sedov | May 17, 2021 | Posters for INI2021, Posters for INI2021 – Special Session on Nitrogen Footprint
Nitrogen footprint of protein-free products Nitrogen (N) footprint: A usefulindicator of potential N pollution. N-calculator method: A bottom-upapproach to obtain N footprint. Expansion needed: Enable to calculate N footprint of protein-free (no...

by Alexander Sedov | May 17, 2021 | Posters for INI2021, Posters for INI2021 – Special Session on Nitrogen Footprint
A nitrogen footprint tool (NFT) for communities Nitrogen footprint tools (NFTs) allow entities to determine the amount of reactive nitrogen lost to the environment as a result of the entities resource use. The community NFT model estimates these loses for census block...

by Alexander Sedov | May 17, 2021 | Posters for INI2021, Posters for INI2021 – 7a. From Science to Policy
Nr management in current Brazilian policies Nitrogen input from human activities escalated significantly in Brazil from 1970 to 2015: emissions of nitrous oxide (N2O), ammonia (NH3), andnitrogen oxides (NOx) together have increased about 350% in the period. Nr...
